Facility Standards
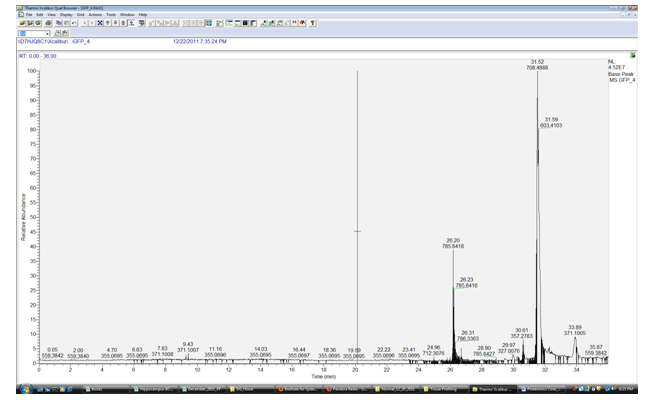
All samples are commonly run with in house standards to ensure that the instrument is working at optimum performance. Each mass spectrometer manufacturer recommends a different standard to access the performance of the instrument that they produce. Thermo Fisher recommends the use of Glu Fibreno peptide which has a m/z value of 785.8424. All thermo instruments run this peptide at the start and end of each set of sample runs. At a 250 femptomolar injection each instrument will have an ideal intensity at which the standard will be detected. This intensity can and will depend on the chromatography of the LC columns being utilized. An example of a “good” standard run would appear similar to the chromatograph below. The mass error of the higher resolution orbi instruments should be between +or – 3ppm. Intensity should ideally be in the low E^7 to high E^6 range. Retention time will of course depend on the length and type of matrix used in the LC column setup but should be within 30 seconds of subsequent standard runs. Contamination should be as minimal as possible and apparent only at the end of the run.
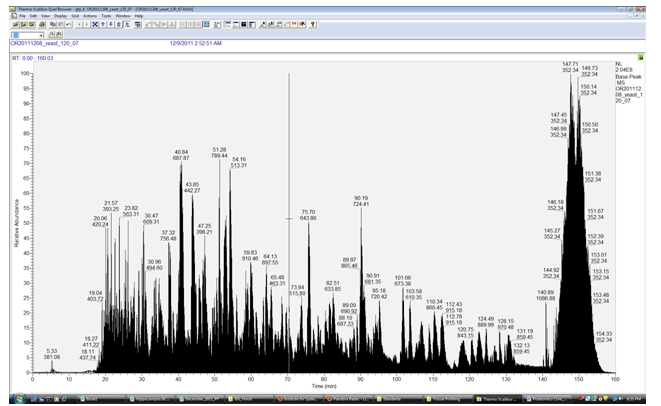
Complex standards are also used to ensure that peptide Identifications are possible and that tandem MS/MS fragmentation is working properly within the trap. Complex standards available for run are often our signature 18 mix sample
Mass Spec tips and troubleshooting
- Sample (protein) precipitation, resolubilization, and digestion;
- Sample cleanup (e.g. by off-line reverse-phase method);
- Isotopic labeling by ICATTM or iTRAQTM for relative quantitation of proteins in complex samples;
- Off-line strong cation exchange fractionation.
- Sample digestion (trypsin): in gel, in solution
- SDS-PAGE
- Offgel electrophoresis
- Quantitation: SILAC, SISCAPA, AQUA, etc.
- Sample cleanup: MCX, C-18
- Custom column preparation: trap, analytical
- HPLC: SCX, RP, fractionation
Protein Identification & Biomarker Discovery
Characterization of post-translational modifications
Quantitation of protein expression
Quantitative Top-Down Proteomics using 2-D gels
Quantitative Bottom-Up Proteomics using LC-MS
Experimental Design for Quantitative Proteomics
Data analysis via ISB proteomics data analysis pipeline: Sequest (Tadam)> Peptide Prophet > Protein Prophet > SBEAMS (Systems Biology Experiment Analysis Management System). Bioinformatics analysis
Training
Independent use